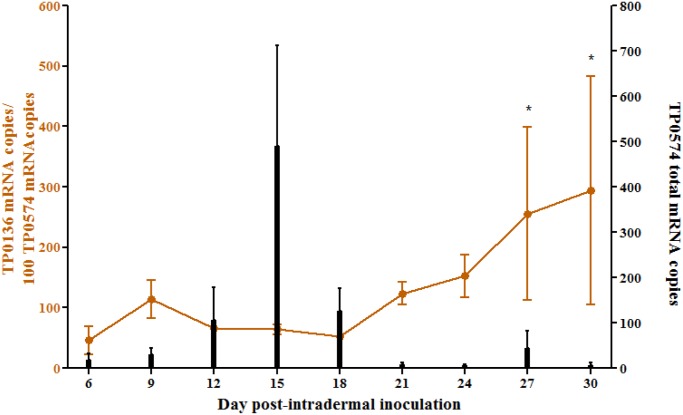
Fig 2. TP0136 message quantification during experimental infection.
For message quantification, a biopsy from the leading edge of a dermal lesion was obtained from each of the three infected rabbits every three days for 30 days. Each sample was amplified in triplicate. The data were reported as the mean values ± standard error (SE) for triplicate experiments. Left y axis shows real-time qPCR analysis of TP0136 message normalized to TP0547 mRNA (orange line) during progression of primary syphilitic lesions in the rabbit model. Although biopsies were obtained at day 0 and day 3 as well, no message quantification was possible from these samples. Newman-Keuls Multiple Comparison Test was used to assess significant differences in TP0136 message level between time points (*p<0.05) whenever a significant difference between sample means was found by ANOVA. Right y axis shows absolute quantification data for TP0574 message (black bars), reflecting absolute T. pallidum burden.

