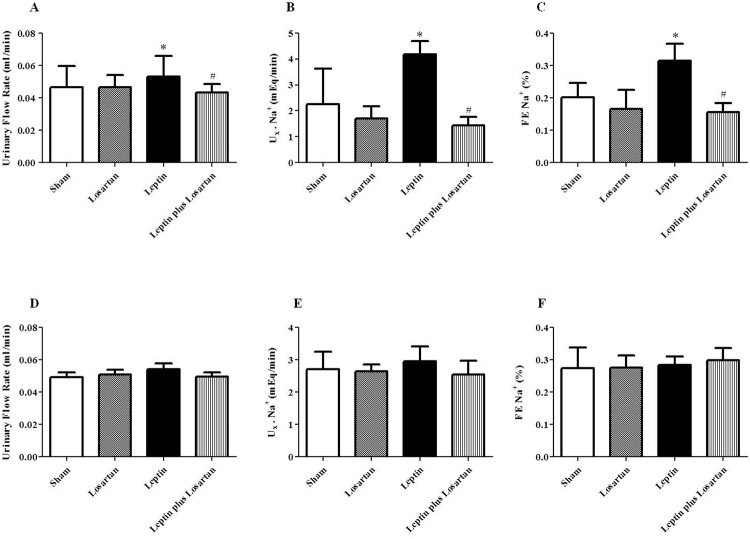
Fig 3. Tubular function.
(A, D) The urinary flow rate (in mL/min) of the rats treated for 7 and 28 days, respectively; (B, E), urinary Na+ excretion (in mEq/min) of the rats treated for 7 and 28 days, respectively; (C, F) fractional excretion of Na+ (in %) of the rats treated for 7 and 28 days, respectively. *p<0.05 versus the sham and #p<0.05 versus the leptin-treated rats. For the rats treated for 7 days: sham (n = 6); losartan (n = 6); leptin (n = 6); and leptin plus losartan (n = 6). For the rats treated for 28 days: sham (n = 6); losartan (n = 6), leptin (n = 8); leptin plus losartan (n = 6).

