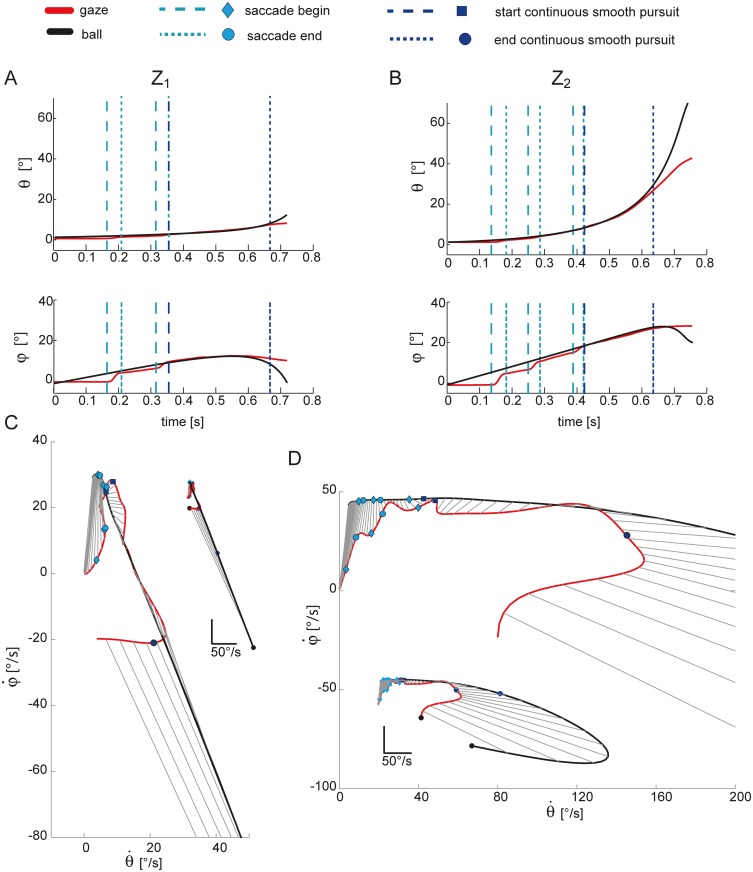
Fig 2. Representative example of eye and ball gaze position and velocity including saccades.
(A) Gaze coordinates of the ball (red lines) and the left eye (black lines) are shown for one trial relative to the T3Z1 condition for one subject (S9). Azimuth and elevation trajectories are plotted up to the impact event; cyan vertical dotted lines bound the saccadic intervals and define the catch-up phase tracking; blue dotted lines bound the interval of CT phase; (B) gaze coordinates of the ball and the left eye in on trial in the T3Z2 condition. (C) scatter plots of the gaze speed in azimuth against gaze speed in elevation for the same trial reported in panel A; (D) scatter plots of the gaze speed in azimuth against gaze speed in elevation for the same trial reported in panel B. Saccadic events are represented by cyan circles (saccade start) and diamond (saccade end); blue square represent the end of the catch-up phase, the magenta circle the end of the smooth pursuit phase, and black circles the impact event.

