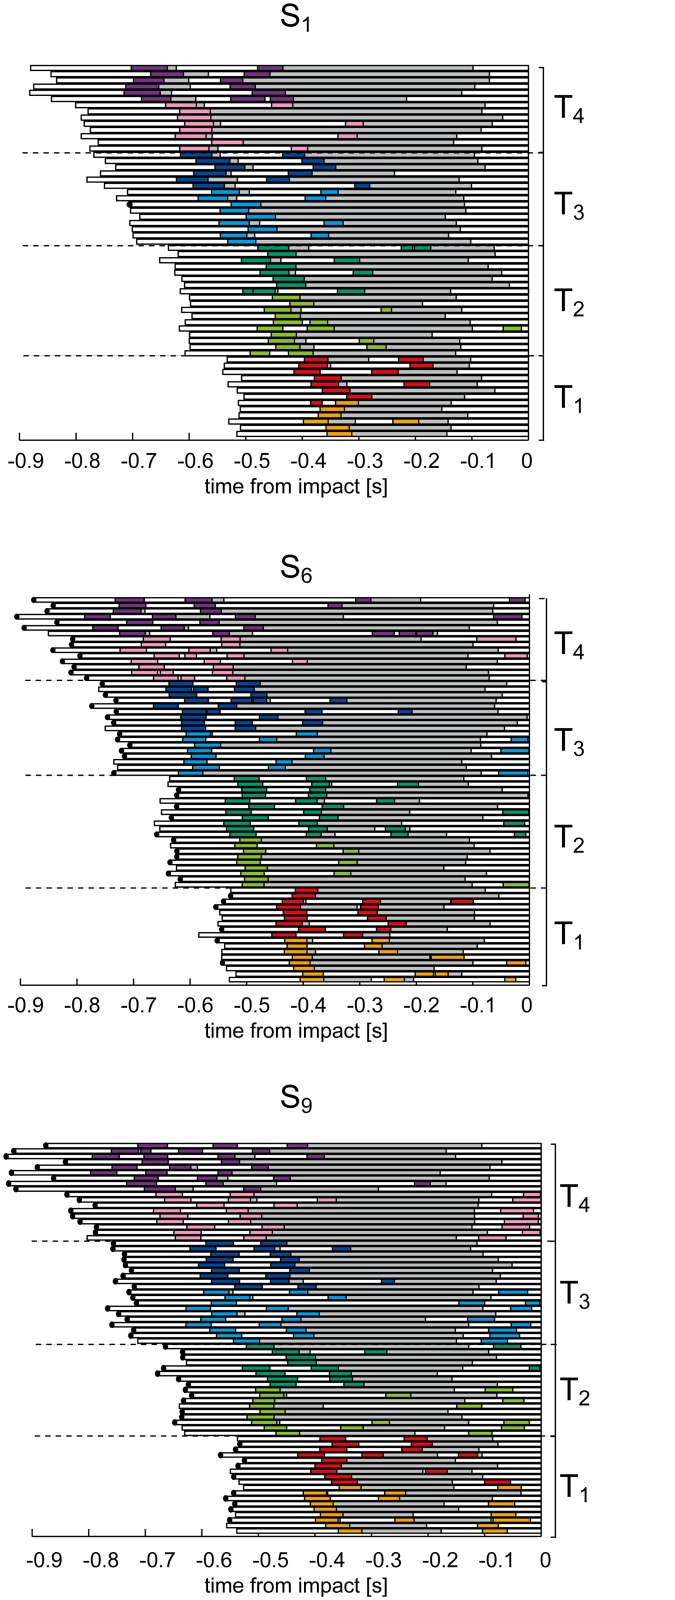
Fig 4. Time course of eye movement events for three subjects of different catching skill level.
Raster plots of eye movement timeline are shown for all the trials collected during the experimental sessions. Data are aligned to the impact time. Colored bars represent saccades: the different T-Z conditions are color coded as reported in Fig. 1. The different time conditions are bounded by the dashed black lines. Gray bars represent the intervals in which the target was foveated (i.e. PE < 3°). White bars represent the intervals in which the subject was not tracking the ball. The black dots at the end of each bar indicate caught trials.

