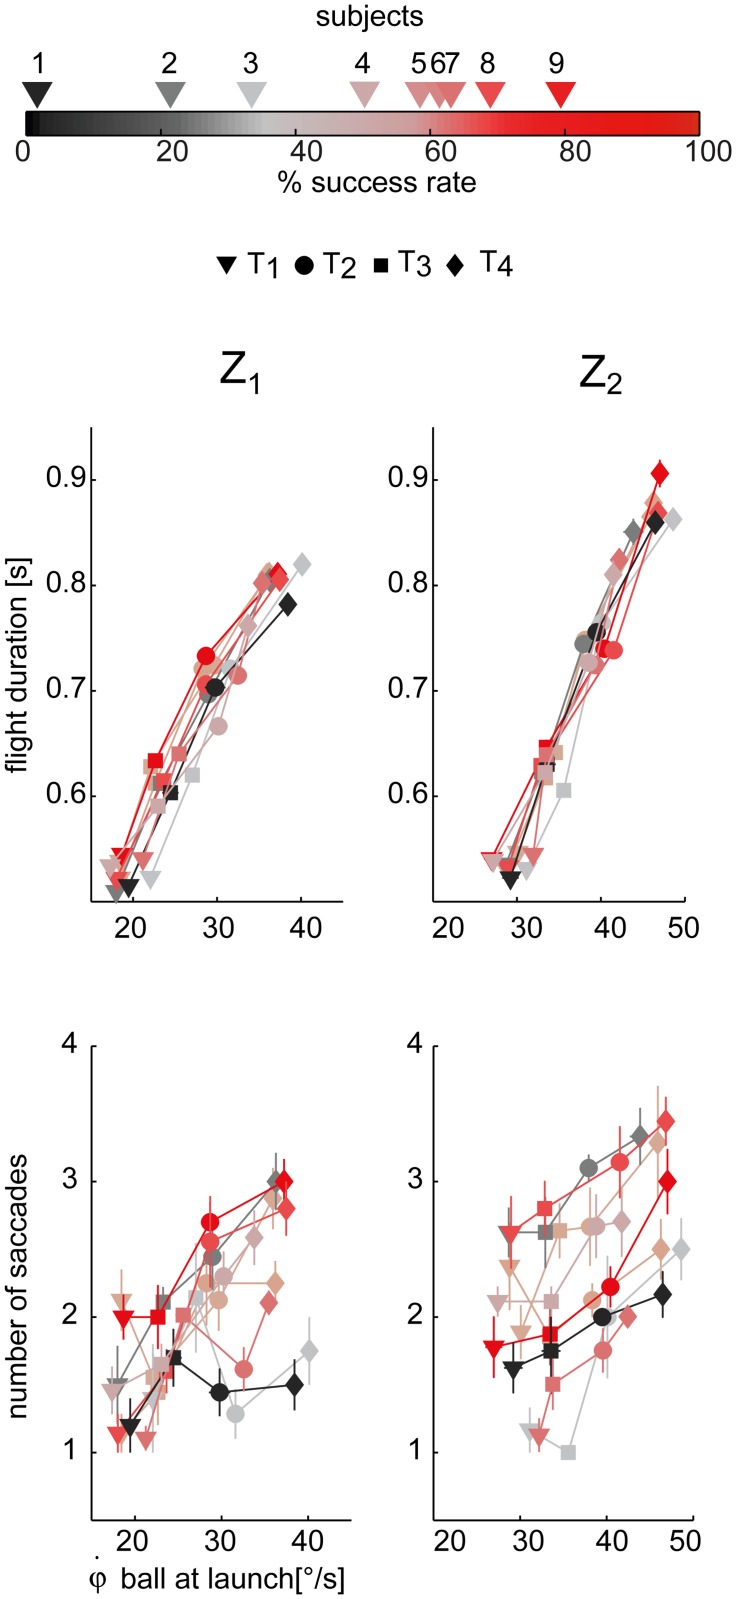
Fig 6. Dependence of ball flight duration and number of saccades on ball initial elevation angular velocity.
Top panel: the ball flight duration (i.e. difference between impact and launch time) averaged across the different T-Z conditions (mean ± SE) are plotted with respect to the initial elevation ball velocity at launch. The four different time conditions are indicated by different marker shapes. Data are illustrated separately for the two different arrival heights (right column: high; left column: low). Subject color coding is reported on top of the figure, and it is shaded ranging from black to red depending on subject average score (i.e. the total number of the caught balls total number of launches). Bottom panel: mean number of saccades throughout the trial.

