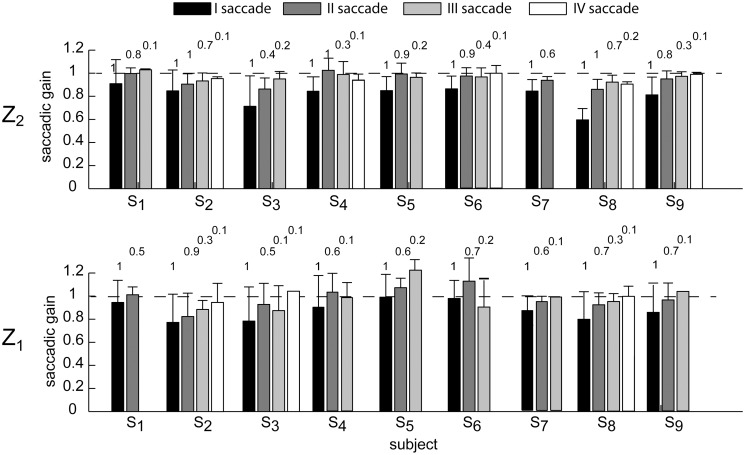
Fig 7. Saccadic gain average distribution across flight duration conditions.
The error bar plots show the saccadic gain for respectively the first, the second, the third, and the forth saccade of each subject enrolled in the experiment. Data are averaged across the four flight duration conditions (mean ± SE), and are illustrated separately for the Z2 (top row) and Z1 (bottom row) ball arrival height conditions. Saccades triggered at end of the trial were excluded from this analysis. The numbers on top of each bar represent the percentage of occurrence of respectively the II, III, and IV saccadic event computed for each subject by pulling together data from the same Z conditions. The first saccade had an occurrence of 100%.

