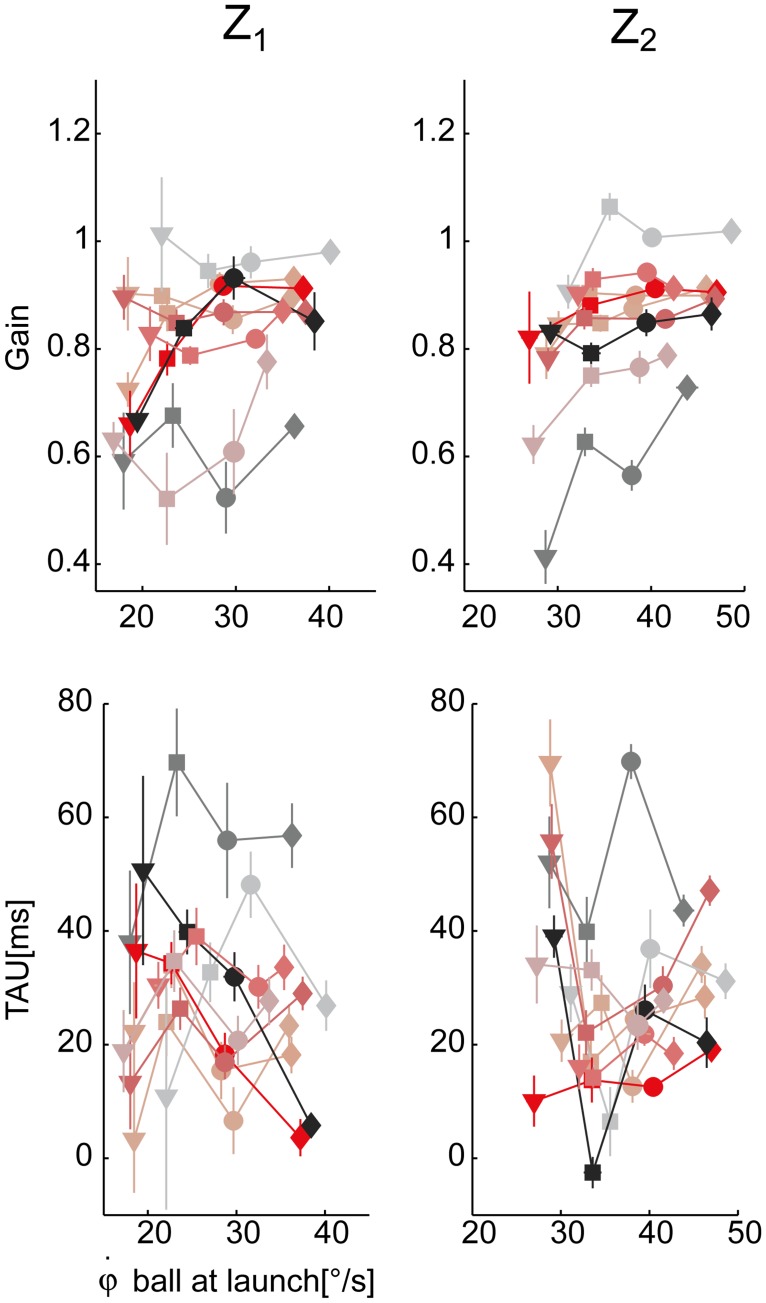
Fig 10. Pursuit accuracy parameters variation across experimental conditions.
Top row: smooth pursuit gain parameter averaged for each subject and experimental condition (mean ± SE) is plotted with respect to the initial vertical angular ball velocity at launch. Data are illustrated separately for the two different arrival heights (right column: Z2, left column: Z1). Bottom row: the eye-ball positional lag parameter (TAU). The different subjects and the four different flight duration conditions are coded as in Fig. 6.

