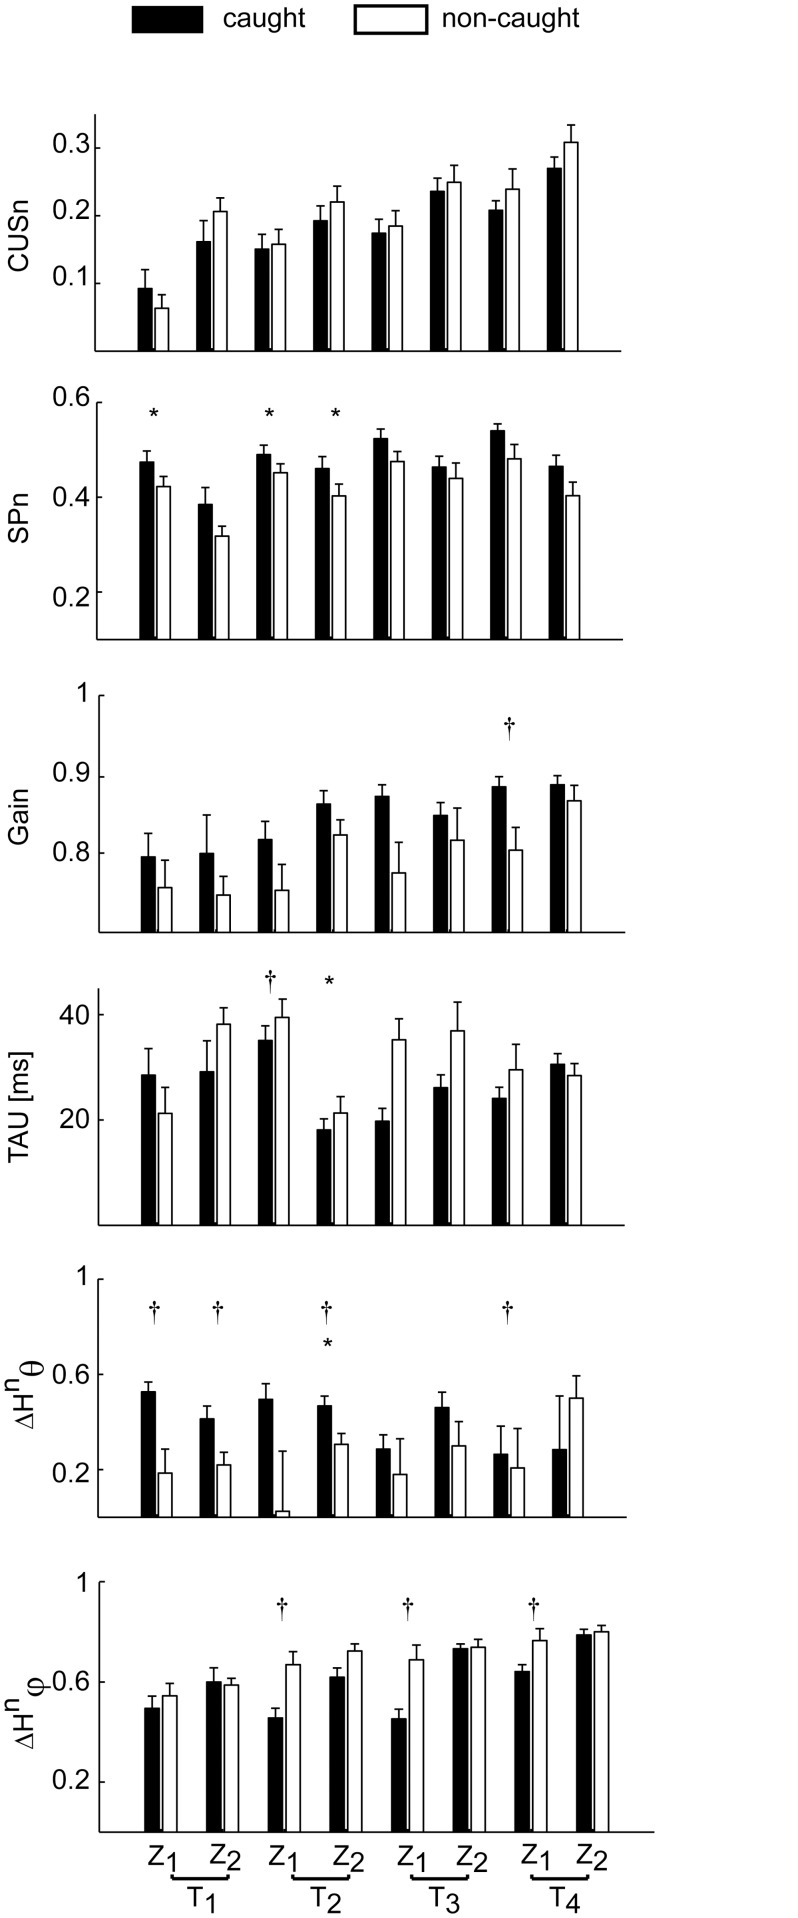
Fig 11. Eye movement parameters averages in caught and non-caught trials.
The distribution (mean ± SE across subjects) between caught (black bars) and non-caught (white bars) trials, of respectively CUSn, SPn, Gain, TAU and the head contribution parameters (azimuth θ and elevation φ) is reported for each T-Z experimental condition. The difference between the two score groups are indicated by the asterisks when present. Significance code: * the variation term in TEST 3 was significant; † the within-subject average term was significant.

