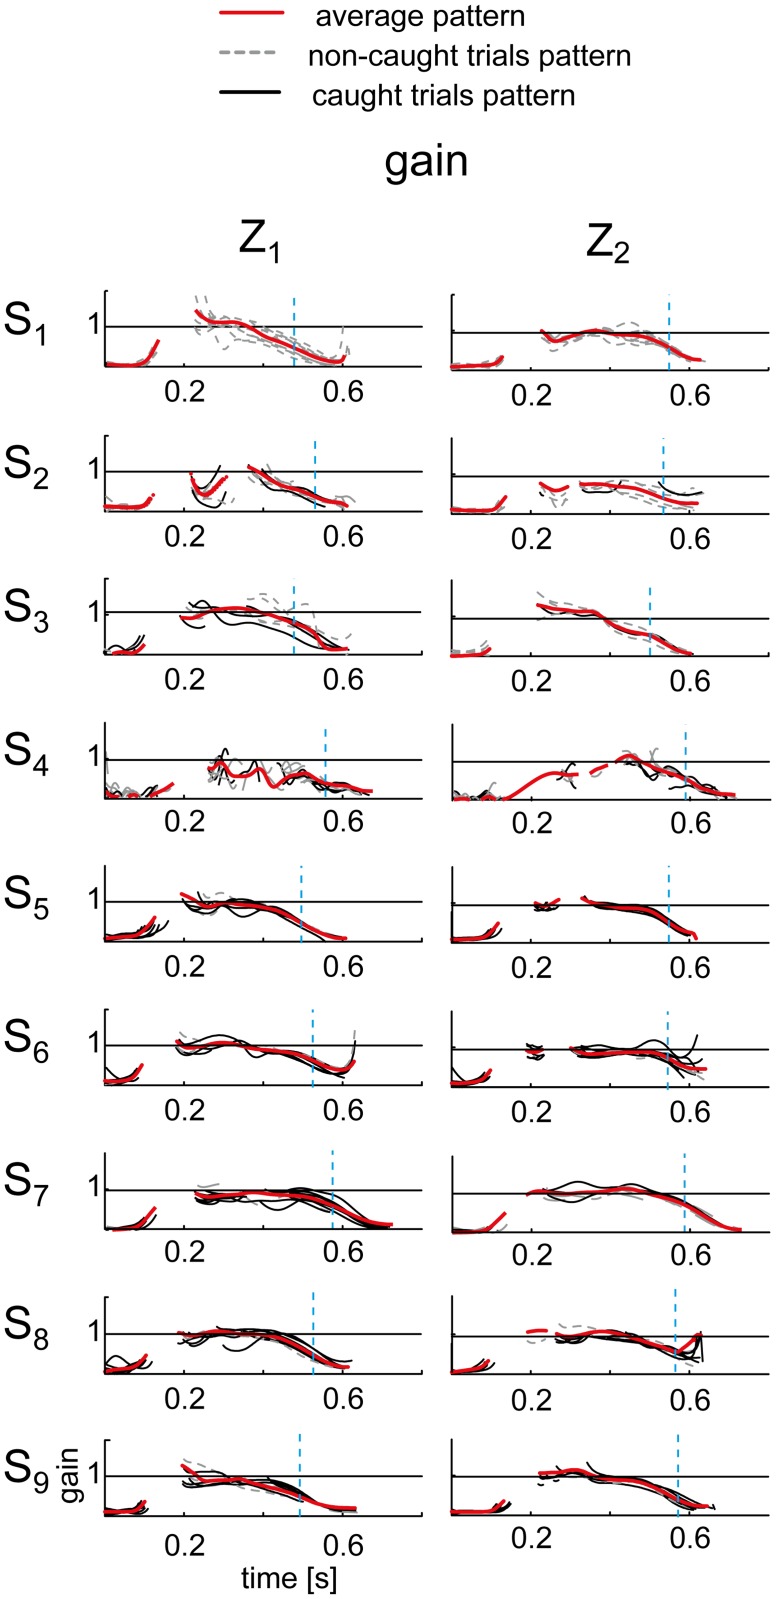
Fig 12. Representative examples of the gain patterns.
Data from all the participants and the trials in the T2 conditions are shown separately for the two ball arrival conditions. Red lines represent the average patterns across trials. Gray dashed lines represent the non-caught trials pattern. Black lines represent the caught trials pattern. The gaps in the traces represent the occurrence of a saccades in all the trials. Inter-individual variability was mainly attributed to subjects S2 and S3 who showed on average, respectively, the lowest gain and highest gain values, while all other participants presented similar pursuit gain. Notably, tracking accuracy was similar between the least skilled subject (S1) and the best catcher (S9). Moreover, no marked differences were visible between caught and non-caught trials.

