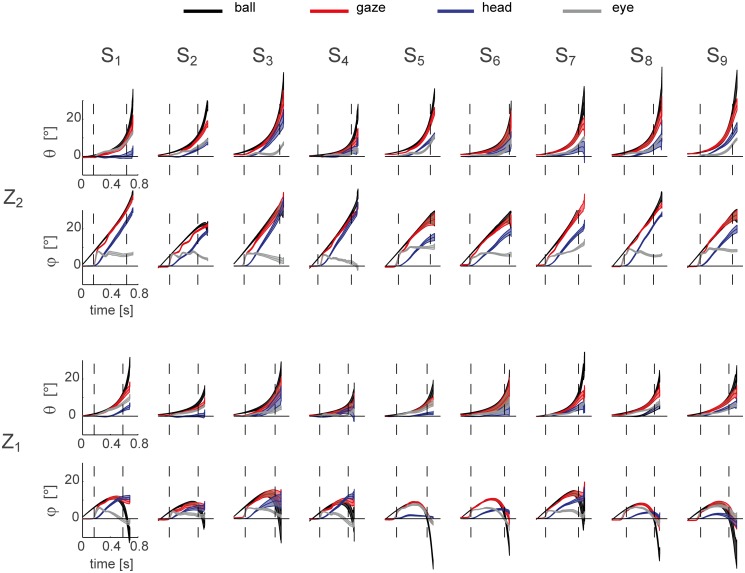
Fig 13. Inter-individual variability in the eye-head coupling.
The average (mean ± SE across trials) ball (black lines), gaze (red lines), head (blue lines), and eye (gray lines) azimuth (θ) and the elevation (φ) trajectories in the T3 conditions are shown for all the subjects enrolled in the experiment. Top rows: Z2 condition; bottom rows; Z1 condition. Trajectories are plotted up to the impact event. Dotted lines bound the pursuit interval defined as the time windows between the end of the first saccadic event and the end of the CT phase. For the purpose of figure clarity we keep out the initial offset of both the eye and head position due to small bias with respect to the primary position defined at calibration (see Methods).

