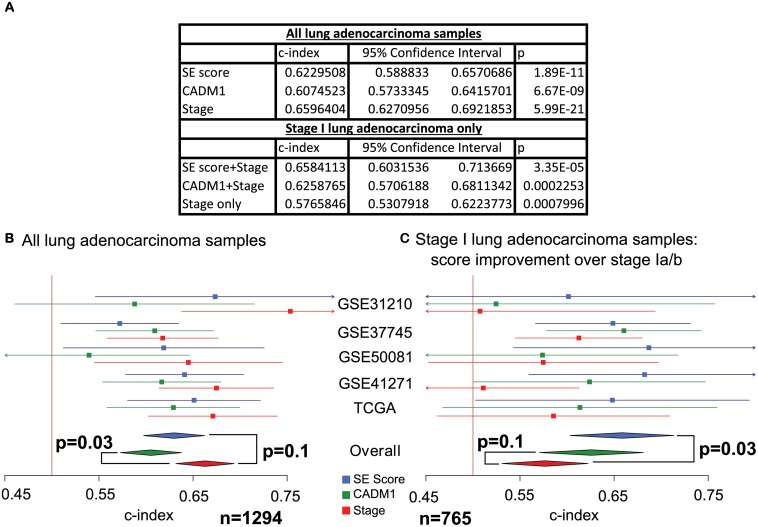
Fig 5. Meta-analysis comparison of the lung cancer SE score with the expression of CADM1.
A) Survival analysis statistics for the SE score and CADM1 expression over all samples and stage I samples, statistics across stage I samples are provided for the 2 scores combined with stage Ia/b status, c-index denotes concordance index and p denotes p-value. B) The plots display the concordance index for the SE score, CADM1 expression and pathological tumour stage in each data set alongside 95% confidence intervals. The overall concordance indices were derived and compared via meta-analysis using a random effects model. The vertical line denotes concordance index = 0.5, data sets where the confidence interval for the concordance index crosses this line did not reach significance. Meta-analysis across 5 validation data sets reveals that the SE score performs comparably to tumour stage, whilst CADM1 expression is outperformed by tumour stage. (C) The plots display the concordance index for the SE score and CADM1 expression combined with stage Ia/b status, as well as stage Ia/b status alone, for stage I samples in each data set alongside 95% confidence intervals. Meta-analysis across 5 validation data sets reveals that only the SE score adds prognostic value to stage Ia/b status.

