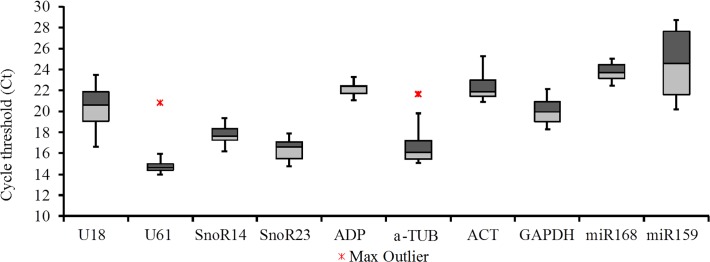
Fig 2. Gene expression of ten candidate internal controls in all samples.

Data points are cycle threshold (Ct) values for each candidate reference gene in all samples. Boxes indicate the 25th (light shading) and 75th (dark shading) percentiles, the line indicates the median and whiskers depict the maximum and minimum values.
