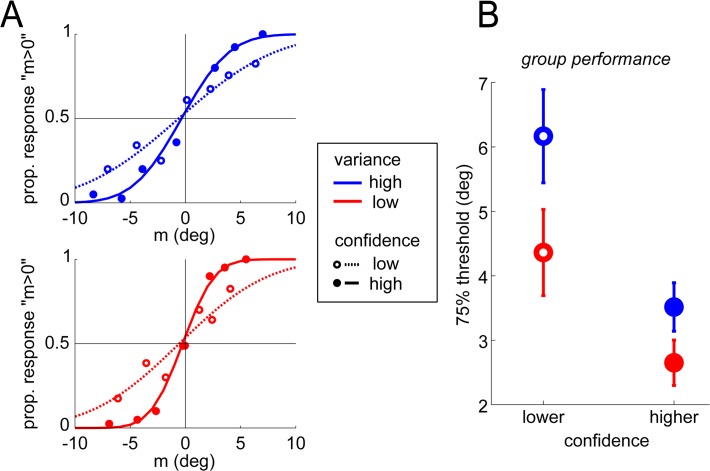
Fig 2. Effects of stimulus variance and reported confidence on performance.
(A) Psychometric curves for one observer in one session, calculated separately for the 2 stimulus variances (red vs. blue) and the 2 confidence judgments (full vs. dotted). Dots represent binned data, lines represent fitted cumulative Gaussians. (B) Motion categorization thresholds averaged across observers, and over the two sessions, for the different conditions. Dots and error bars represent the mean and SEM of thresholds, across participants.

