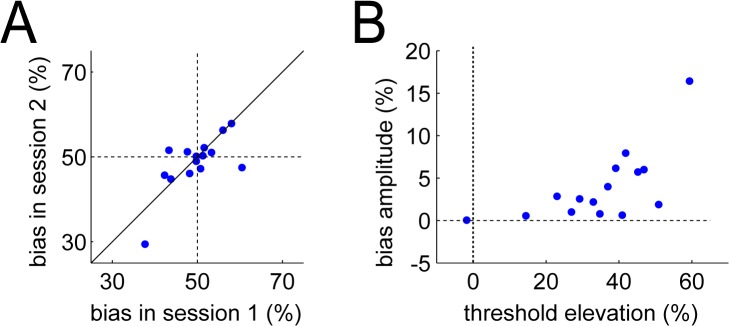
Fig 3. Effects of stimulus variance on confidence.

In both panels each point is an individual observer. (A) The percentage of equal performance pairs in which the low variance stimulus was associated with higher confidence, calculated separately for session 1 and session 2. Individual estimates are aligned on the diagonal, showing that they were consistent across the two sessions. (B) The more the stimulus variance affected performance (x-axis: threshold elevation), the more it affected confidence (y-axis: amplitude, i.e. deviation from 50%, of the mean bias).
