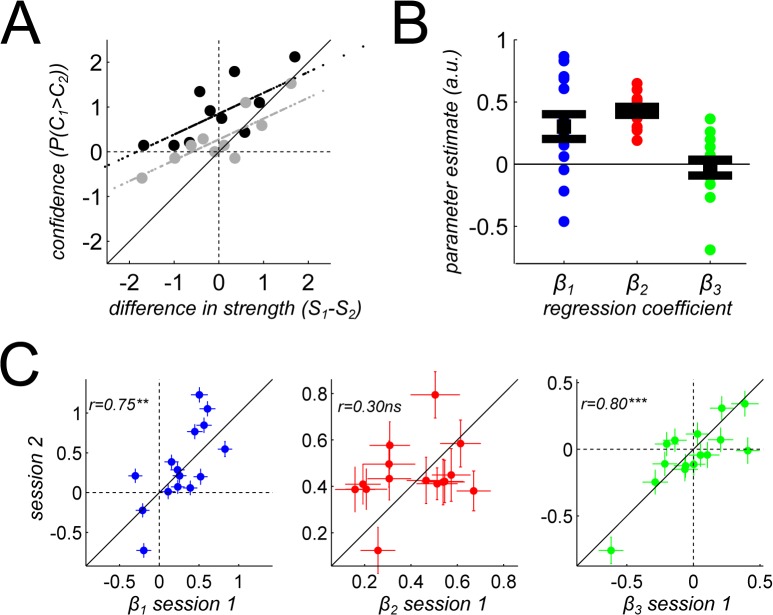
Fig 4. Logistic regression for confidence.
(A) The metacognitive regression curve for one participant, plotting confidence comparison responses (in probability, y-axis) against differences in signal-to-noise ratios between the two trials to be compared (threshold units, x-axis). Large dots are real data, binned along the x-axis variable. Aligned small dots are regression fits. Trial pairs in which the low variance stimulus was presented first (resp. second) are presented in black (resp. gray). (B) Parameter estimates for the logistic regression (EQ1). Small dots represent for each participant the average estimate of the parameter across the two sessions. Big dots and error bars represent the mean and SEM at the group level. (C) Stability of parameter estimates across the two sessions, one week apart. For each predicting variable, we plotted the beta coefficient measured on the second session against the value on the first session, and report the correlation between the two sessions. Error bars represent the standard errors for each parameter estimate. Cross-sessions correlations are reported along with their significance (** p<0.01, *** p<0.001).

