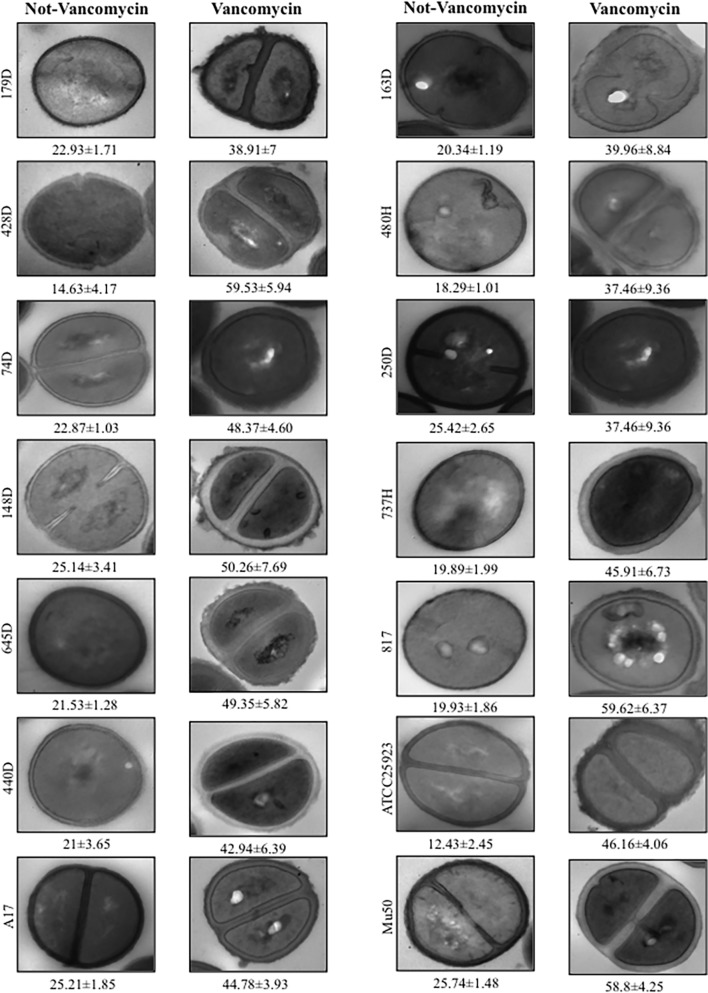
Fig 3. Comparison of the cell wall thickness in the presence and absence of vancomycin among the VT-MRSA clinical isolates after cultivation in BHI broth.
(A) Untreated VT-MRSA clinical isolates. (B) VT-MRSA clinical isolates treated with vancomycin at concentrations gradually increased by 1 μg until reaching a final concentration of 20 μg/mL. The micrographs of the thin transverse sections were processed to 100,000x magnification. The values shown under each bar represent the means and SDs of the cell wall thickness in nanometers.

