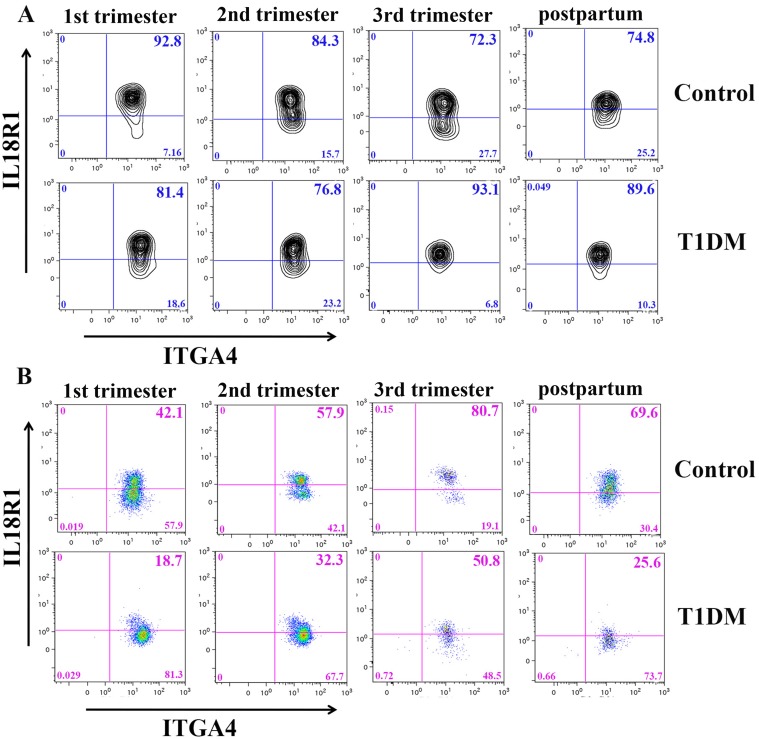
Fig 7. Homing receptor expression by Type 1 CD56bright NK and NKT cells.
(A) Representative contour plots of Type 1 CD56bright NK cells expressing ITGA4 analysis from a control (upper panel) and a T1DM (bottom panel) patient are shown. (B) Representative pseudocolor dot plot of Type 1 NKT cells (CD3+CD56+) expressing ITGA4 from a control (upper panel) and T1DM (bottom panel) patient.

