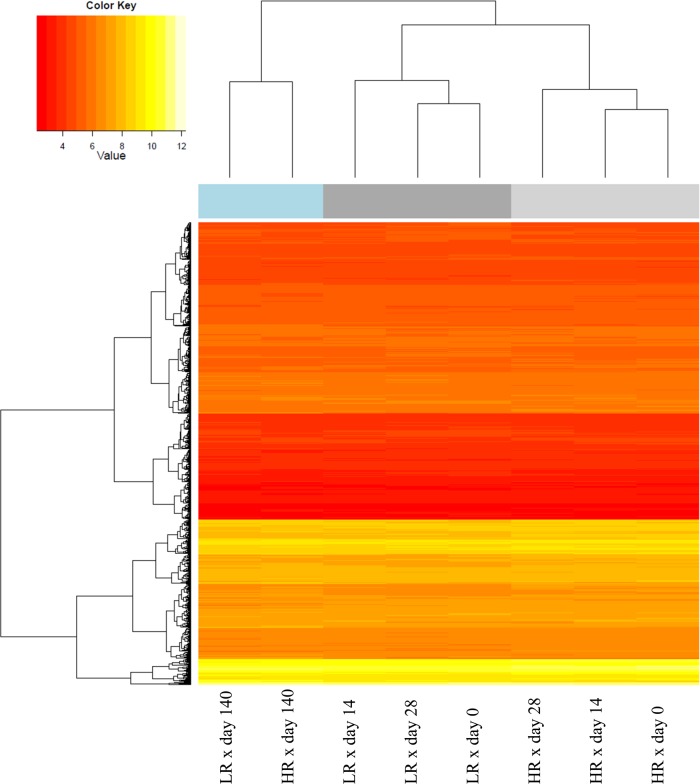
Fig 2. Heatmap displaying probe-sets with significantly altered mRNA abundances.
Effects mediated by coping group appeared to dominate early sampling points (day 0, day 14, day 28). Later, age-specific effects were more pronounced as visualized by young adult subgroups (day 140). Columns = variance component coping group x time; Rows = transcripts showing altered mRNA abundances between HR and LR on at least one time point; HR—High resisting; LR—Low resisting.

