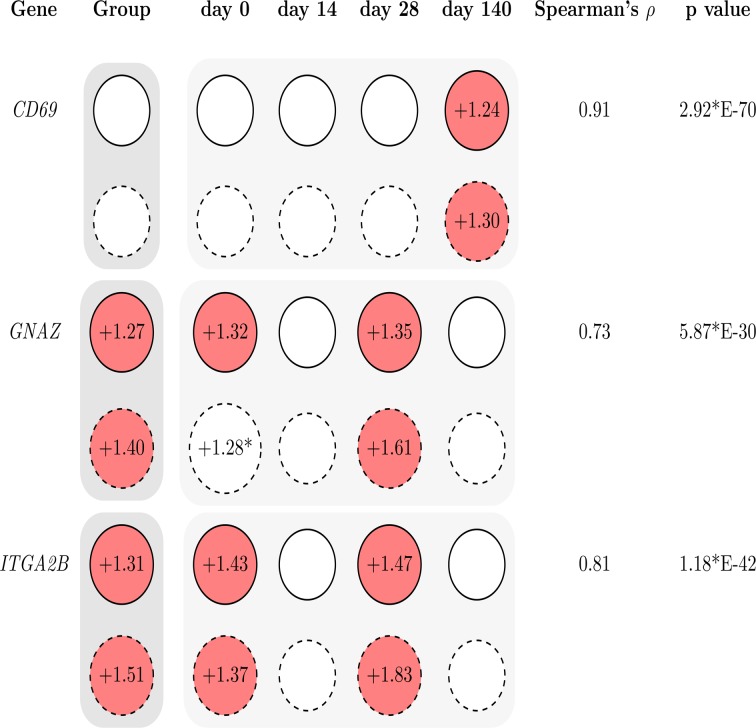
Fig 3. Comparison of microarray and quantitative PCR (qPCR) results for selected transcripts (CD69, GNAZ, ITGA2B) to verify microarray data.
Values were calculated by factorial normalisation on IQGAP1 and TSC22D2 expression values. Fold-changes displayed in red circles indicate significant differences in mRNA abundances between HR and LR at either microarray (solid lined circles) or qPCR data (dashed lined circles). Positive values display increased mRNA abundances in HR (HR > LR). Correlation of normalized expression values was calculated by Spearman (n = 176). * p = 0.06.

