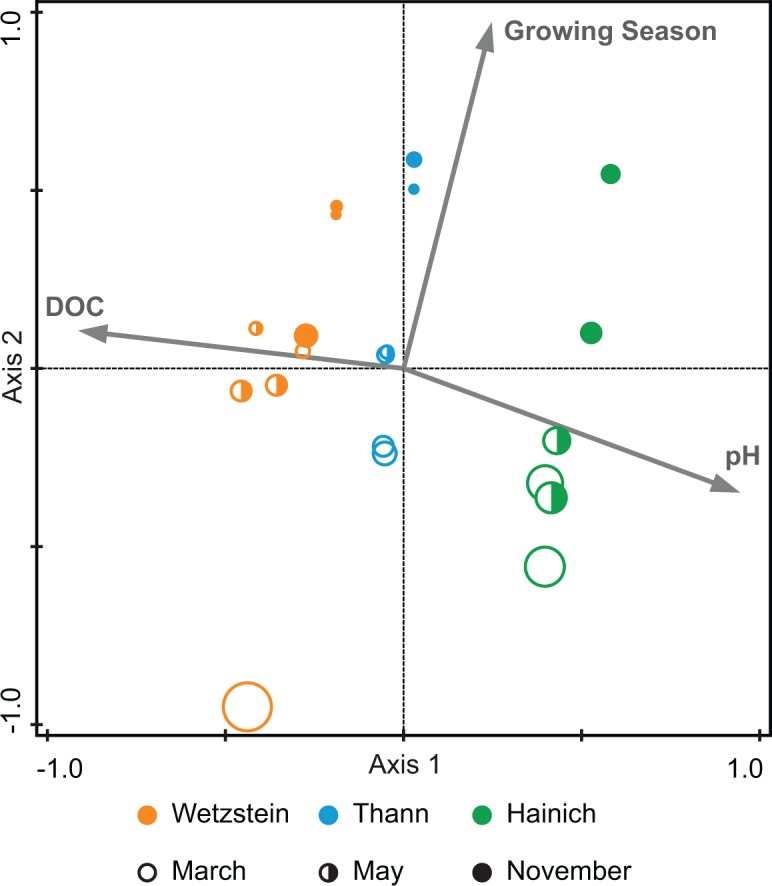
Fig 2. Species diversity diagram based on RDA with molecular formulae as responsive variables and pH, DOC concentration and length of growing season as explanatory variables.

Variability explained: Axis 1, 30%; Axis 2, 8.6%. DOC concentration, pH and length of growing season together explain 42% of the variability in formulae. The greater the circle diameter, the greater the number of molecular formulae per measurement (range of formulae per measurement: 1062 to 1334).
