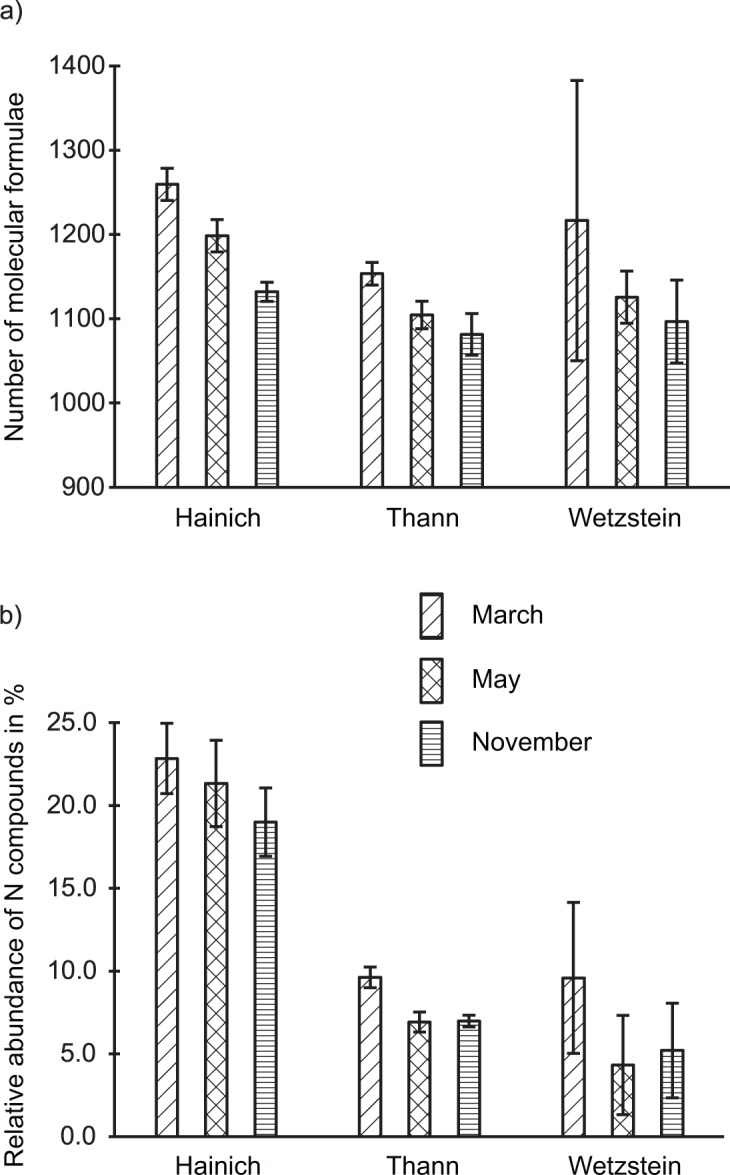
Fig 6. Overview of abundance of molecular formulae per month and main site.

(a) Average abundance of formulae, (b) average relative abundance of nitrogen-containing compounds. Error bars indicate standard deviation between individual sampling spots or replicate measurements.
