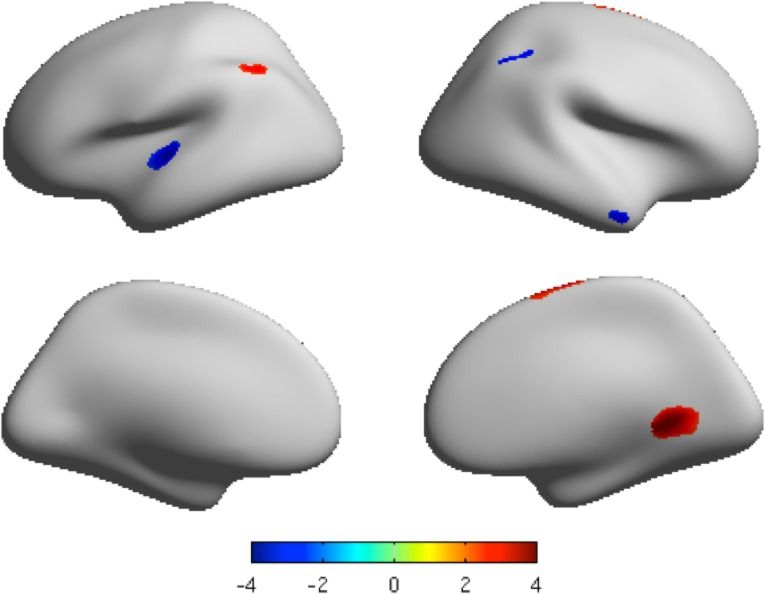
Fig 2. The clusters with significant different local surface area projected onto the average cortical surface.
Lateral view and medial view by inflated surfaces, color-coded by t-scores. Red means that MDD has higher surface area than that of controls, and blue means that MDD has lower surface area than that of controls. P < 0.05 FDR corrected, cluster size > 200 vertices.

