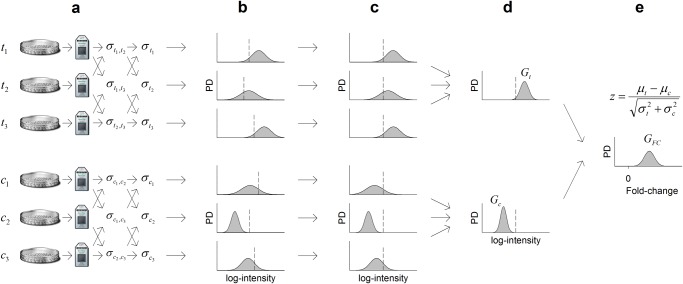
Fig 2. A flow chart of HTA.
Here HTA is applied to analyze a gene by contrasting two triplicate cohorts: {t 1,t 2,t 3} vs. {c 1,c 2,c 3}. (a) Estimation of samplewise error variances. (b) Assigning of a Gaussian to each measurement of log-intensity as the probability density (PD) function of its true value. (c) Application of scaling normalization to align the arrays’ log-intensity means, marked with the dashed lines. (d) Derivation of the PDF of each cohort’s mean. (e) Derivation of the PDF of the true fold-change and calculation of the z-statistic for evaluating differential expression of the gene.

