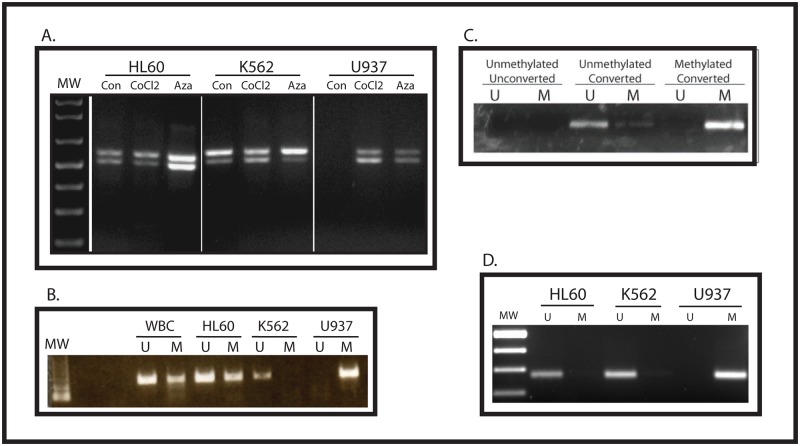
Fig 1. Intron 1 CpG island methylation status correlates with WT1 expression.
(A) RNA was isolated from control K562, U937, and HL60 cells, as well as from cells treated with CoCl2 or 5-azacytidine, and was analyzed by RT-PCR using primers that span exon 5 of the WT1 mRNA. In each lane, the upper band represents the WT1 isoform containing exon 5, and the lower band represents the WT1 isoform lacking exon 5. Molecular weight markers (MW) are shown. (B) Genomic DNA was isolated from white blood cells (WBC) or from the indicated cell line, treated with sodium bisulfite, and analyzed my methylation-specific PCR using primers (validated in a previous publication [18]) specific for the WT1 promoter CpG island. U = unmethylated DNA, M = methylated DNA, MW = molecular weight markers. (C) Validation of new MSP primers. Genomic DNA was isolated from U937 cells (unmethylated) and from K562 cells (methylated) and treated with (converted) or without (unconverted) sodium bisulfite. PCR was performed with primers specific for the unmethylated, converted sequence (U) and for the methylated converted sequence (M). Each primer pair specifically amplifies the appropriate DNA sequence, and neither amplifies unmethylated unconverted DNA. (D) Genomic DNA was isolated from the indicated cell line, treated with sodium bisulfite, and analyzed by methylation-specific PCR using primers specific for the Intron 1 CpG island. U = unmethylated, M = methylated.

