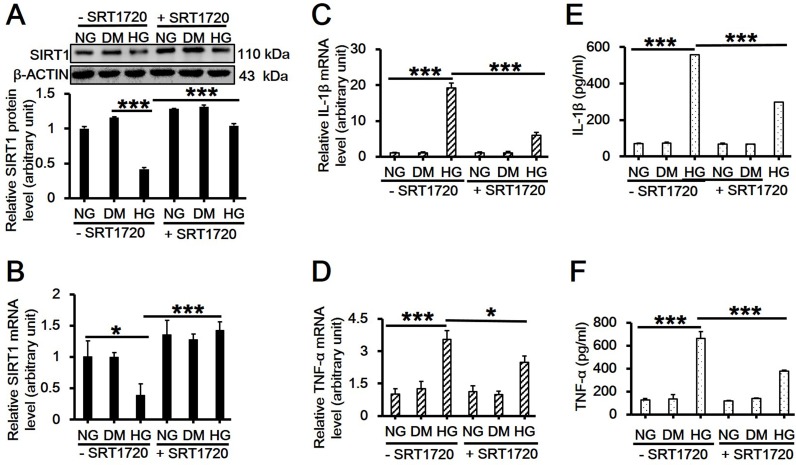
Fig 4. Effects of SIRT1 activator SRT1720 on the expression and/or release of SIRT1, IL-1β and TNF-α in RAW264.7 cell culture treated with 30 mM high glucose.
(A-D) RAW264.7 cells were pretreated with 1 μM SRT1720 for 6h and then cultured in 30 mM D-glucose-containing medium for additional 8h. Cells were then harvested and used for western blot analysis for SIRT1protein level (A, df = 5, f = 53.307, p < 0.001), and real-time PCR analysis for SIRT1 (B, df = 5, f = 16.042, p = 0.002), IL-1β (C, df = 5, f = 328.474, p < 0.001) or TNF-α mRNA level (D, df = 5, f = 43.581, p < 0.001). Each data point is the mean ± SEM of n = 3 and normalized against corresponding β-ACTIN protien level or GAPDH mRNA level with the value in NG without SRT1720 group arbitrarily set as 1. (E-F) The culture medium was also collected and used for ELISA for detecting the release of IL-1β (E, df = 5, f = 5739.982, p < 0.001) and TNF-α (F, df = 5, f = 108.365, p < 0.001). Each data point is the mean ± SEM of n = 3. *p < 0.05; ***p < 0.001. 30 mM of D-mannitol served as an osmotic control. ‘NG’, 5.6 mM normal glucose; ‘HG’, 30 mM high glucose; ‘DM’, 30 mM D-mannitol.

