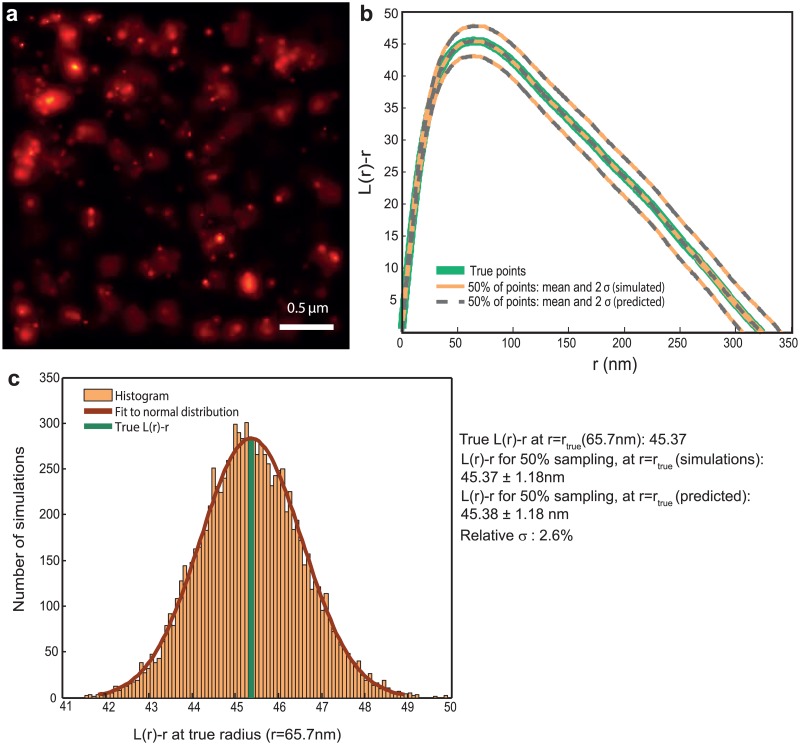
Fig 1. Ripley’s L(r) − r function is invariant to random subsampling.
(a) Probability map representation of a PALM image of β2–adrenergic receptor molecules labeled with mEos2 on the plasma membrane of HeLa cells, post agonist addition. Density: 650 molecules/μm −2. (b) L(r) − r functions for the true and subsampled points, estimates for the latter obtained from both simulations and the analytical method presented. Continuous green: Ripley L(r) − r function L true(r) − r corresponding to the points in (a). Orange: mean and 2σ bounds of L(r) − r functions corresponding to 10000 realizations of random sampling 50% of the points in (a). Broken lines: the mean and 2σ bounds corresponding to 50% subsampling, predicted by the analytical method presented. It can be seen that the mean values obtained from both simulations and analytical method coincide with L true(r) − r, and that the 2σ curves obtained from the simulations and the analytical method coincide. (c) Histogram of L(r) − r of the subsampled realizations at r = r true, where r = r true is the cluster radius corresponding to the maxima of the L true(r) − r function. It can be seen that it follows a normal distribution, with the fit parameters similar to that obtained from the analytical method. r true is also plotted (dark green). The relative standard deviation (σ/μ, i.e, ) at r = r true is 2.6% for 50% subsampling.

