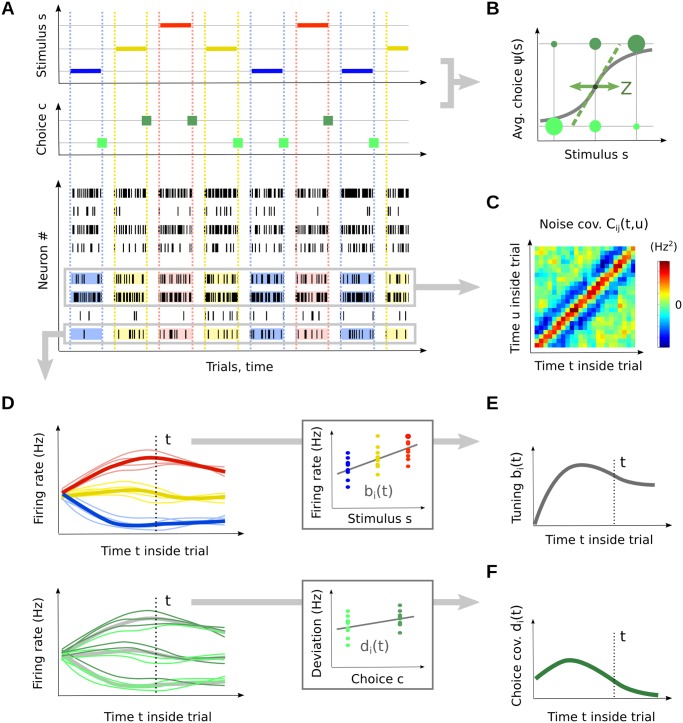
Fig 1. Framework and main experimental measures.
(A) Experimental setup. Top: A set of stimulus values s (color-coded as blue, yellow, red) are repeatedly presented to an animal. Middle: The animal’s choice c on each trial (green) indicates whether the animal judged s to be larger or smaller than the fixed central value, s 0. Bottom: In each session, several task-relevant sensory neurons are recorded simultaneously with the behavior. (B) The psychometric curve ψ(s) quantifies the animal’s sensory accuracy. Its inverse slope in s 0 provides the just-noticeable-difference (JND), Z. (C) The noise covariance structure can be assessed in each pair of simultaneously recorded neurons, as their joint peri-stimulus histogram (JPSTH) C ij(t, u). (D) Responses of a particular neuron. Each thin line is the schematic (smoothed) representation of the spike train on one trial. Segregating trials according to stimulus (top), we access the neuron’s peri-stimulus histogram (PSTH, thick lines) and its tuning signal b i(t)—shown in panel (E). Fixing a stimulus value and segregating trials according to the animal’s choice c (bottom), we access the neuron’s choice covariance (CC) curve d i(t)—shown in panel (F).

