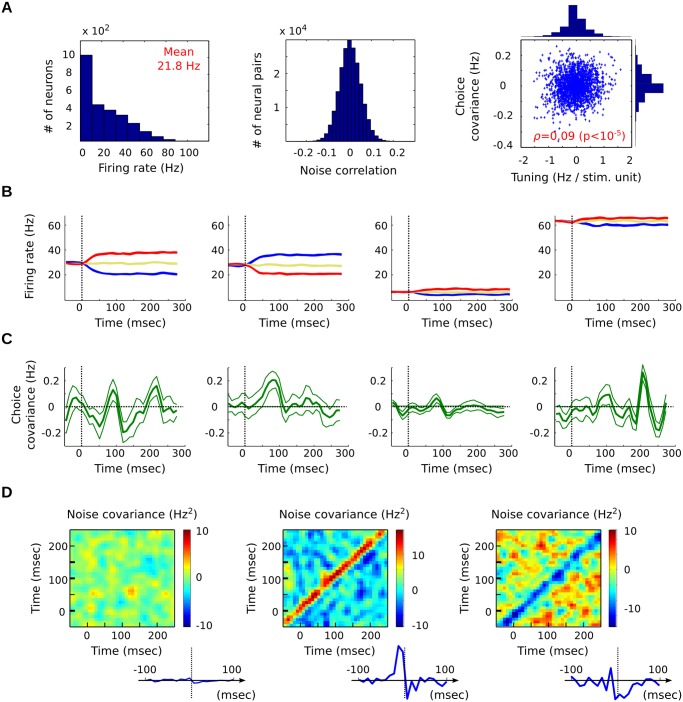
Fig 4. Simulated neural network used for testing the method.
(A) Spike count statistics amongst the population of 5000 neurons (spike counts over 400 msec, on 3 × 180 stimulus repetitions). Note the weak, but significant, correlation between tuning (b i) and choice covariance (d i). (B) Sample PSTHs: the model neurons display varied firing rates, and tunings of different polarities. (C) Sample choice covariance curves for the same neurons as panel B (thin lines: bootstrap-based error bars). (D) Sample JPSTHs (noise correlations) for pairs of model neurons. Inset: corresponding cross-correlograms, obtained by projection along the diagonal. For better visibility, the curves in panels B-D were computed from a larger number of trials (3 × 3000) than used for the study itself (3 × 180), and time-averaged with a 10 msec Gaussian kernel.

