
Fig 6. Statistical recovery of readout parameters: best fit parameters.
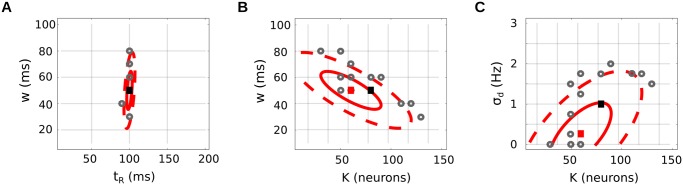
Efficiency of the inference method, applied to our simulated LIF network. The three panels show different 2d projections of the underlying 4d parameter space: (t R, w) plane (A), (K, w) plane (B), (K, σ d) plane (C). Black square: true parameters used to produce the data. Red square: best fit parameters (K, w, t R, σ d), achieving the minimum of the loss function in eq. 16. Gray points: best fit parameters for 14 (bootstrap) resamplings of the original trials (some points are superimposed, due to the finite grid of tested parameters). Red ellipses: corresponding confidence intervals, as the 1- and 2- standard deviation of the bootstrap resamplings.