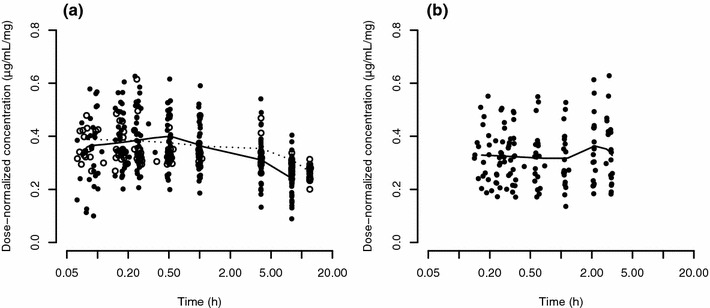
Fig. 1.

Dose-normalized plasma concentration–time curves of ferumoxytol for (a) healthy volunteers and (b) CKD patients on haemodialysis. For better visualization, only early time points are shown, and data on the abscissae is presented on the log-scale. Time points were jittered using the jitter function in R to improve visibility of single observations. In the healthy volunteer subplot, closed and empty circles correspond to concentration values obtained from studies A and B, respectively, while all concentration values in the CKD subplot originate from study C. Smooth lines were generated using the loess function in R, with the solid and dashed lines in the healthy volunteer subplot corresponding to data from studies A and B, respectively. CKD chronic kidney disease
