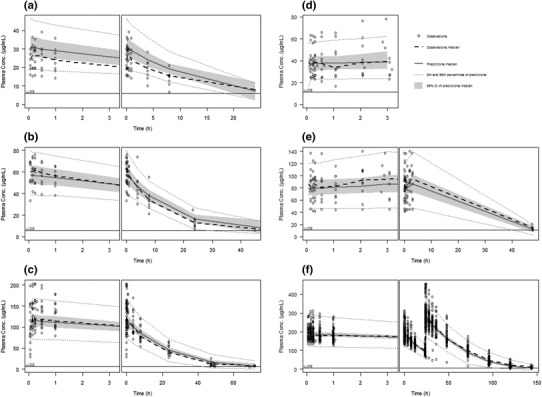
Fig. 2.

Visual predictive checks for the final ferumoxytol model for all treatment regimens. Each subplot shows the first 3 h after the first dose in the left-hand panel, and the whole range of observations of the respective dose in the right-hand panel. Subplots a–c correspond to observations from study A at doses of 1, 2 and 4 mg/kg, respectively. Subplots d–e correspond to observations from study C at doses of 125 and 250 mg, respectively. Subplot f represents observations from study B following two 510-mg doses administered within 24 h
