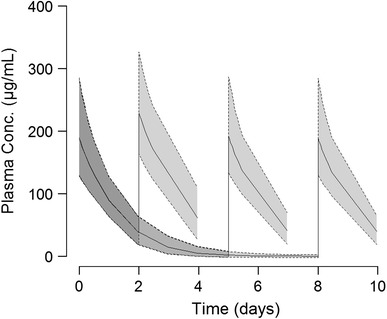
Fig. 4.

Plasma concentration–time profiles after two simulated administrations of 510 mg ferumoxytol in a combined population of healthy volunteers and CKD patients not on haemodialysis. The second dose was administered 2, 5 or 8 days after the first dose as an illustration of approved ferumoxytol dosing regimens. Solid lines and shaded areas represent median and 90 % prediction interval, respectively. CKD chronic kidney disease
