
Fig. 10.
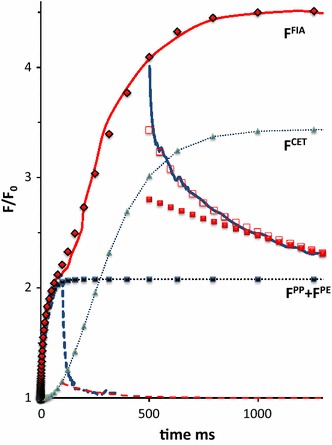
Linear time plot, similar as in Fig. 9, except for ten-fold attenuation of pulse intensity and plant (leaf) species, of F exp(t) in a Arum italliensis leaf upon a 500 ms (s) SP500 and a 1 s SP, both of 300 µmol photons m−2 s−1 intensity. Here the blue dashed line is the decay of the sSP100 response. Meaning of symbols and labeled curves is the same as in Fig. 9