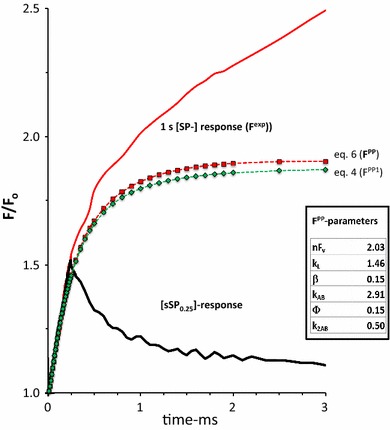
Fig. 4.

The 3 ms linear time plot of the variable fluorescence response in a Kalanchoë leaf upon a 0.25 ms sSP0.25 (black-colored) and a 1 s SP (red-colored) both of 3000 µmol photons·m−2 s−1 intensity. The two pulses are given sequentially at an intermediate dark period of a few seconds. The curves with green diamonds and red squares are the graphic plots of the calculated variable fluorescence associated with the release of primary photochemical quenching without (F PP1) and with (F PP) supplemental quenching release associated with double reduction of QB-nonreducing RCs, respectively. F PP1 and F PP are calculated using Eqs. 4 and 6 with substitution of the parameter values estimated from the kinetic- and steady state analyses illustrated in Figs. 1 and 2, except φ and k 2AB, and are given in the table in the insert
