Fig. 5.

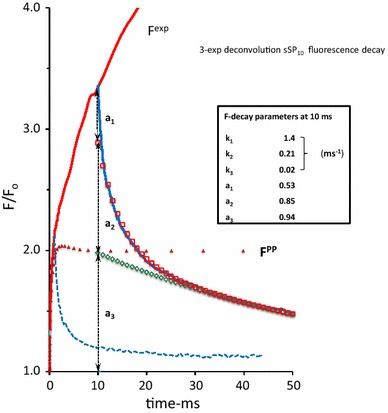
The 50 ms linear time plot of the variable fluorescence response (F exp(t)) in a Kalanchoë leaf upon a 10 ms short saturating pulse sSP10 (blue-colored) and a 1 s SP (red-colored), both of 3000 µmol photons m−2 s−1 intensity. The two pulses are given sequentially at an intermediate dark period of a few seconds; the 10 ms rising part of the sSP10 response coincides with that of the SP response. The green open diamonds and red open squares are of the slow (k 3) and moderate(k 2) component, respectively of the 3-exponential deconvolution of the sSP10 decay curve. Values of amplitudes (a j) and rate constants (k j) of each of the components are given in the insert. The blue dashed line is, for comparison and reproduced from Fig. 1, the decay of the sSP0.25 response. The red colored triangles are of the variable fluorescence curve F PP (t), reproduced from Fig. 4. Note the substantial increase of, in particular the amplitude of the slow (a 3) and moderate (a 2) components of the F(t) dark decay associated with the F(t) rise in the 10 s time domain
