
Fig. 8.
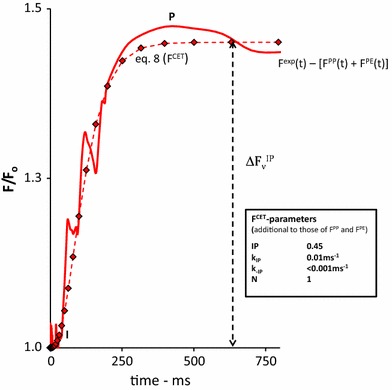
The 750 ms linear time plot of the variable fluorescence response , complementary to the fluorescence rise caused by F PP(t) and F PE(t), upon a 1 s saturating pulse SP (red line) of 3000 µmol photons m−2 s−1 intensity in a Kalanchoë leaf. The curve is obtained after subtraction the sum of F PP(t) and F PE(t) from F exp(t) (see Fig. 7). The curve with red diamonds is the graphic plot of Eq. 8 attributed to F PE(t), with substitution of the parameter values estimated for F PP(t) (see insert Fig. 4) and supplemented with those estimated for k qbf and k −qbf, given in the insert table, to obtain the best fit with the experimental curve in the 0 to 30 ms time domain, after ‘correction’ for F PP(t)