
Figure 6.
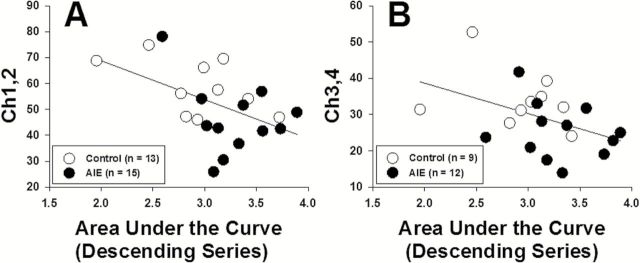
Correlations between choline acetyltransferase (ChAT) immunoreactivity cell counts and area under the curve (AUC) of the probability discounting function in the Ch1 and Ch2 nuclei (medial septal nucleus and nucleus of the vertical limb of the diagonal band) (A) and Ch3 and Ch4 nuclei (lateral portion of the horizontal limb nucleus of the diagonal band, nucleus basalis, and parts of diagonal band nuclei) (B) of the basal forebrain. The correlation between ChAT+ IR in the Ch1 and Ch2 nuclei and AUC (left) was significant (p<0.05), and the correlation between ChAT+ IR in the Ch3 and Ch4 nuclei (right) was nearly significant (p=0.05; see text for details).