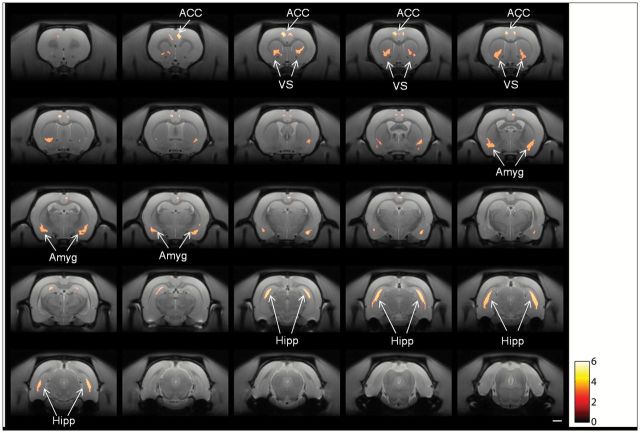
Figure 5.
Coronal sections showing areas of significant differences in grey matter between rats treated with saline and PCP. The horizontal scale bar is 2mm; the color scale shows the student’s t-score. Results shown are significant at a cluster-level corrected family-wise error of p < 0.05. The test performed was two-tailed, but only grey matter reductions were observed. ACC, anterior cingulate cortex; VS, ventral striatum; Amyg, amydaloid regions; Hipp, hippocampus.

