
Figure 1.
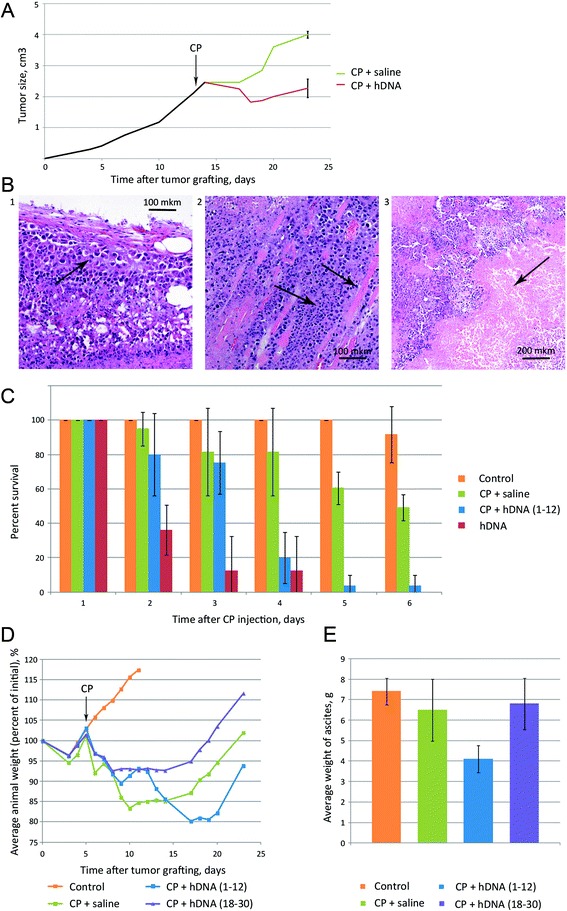
Effects of CP and/or hDNA treatments on Krebs-2 tumor cells propagated as ascites or solid tumors. А) Growth of solid Krebs-2 tumors in animals treated with CP followed with hDNA or saline injections (n = 4). Time of CP injection is denoted by an arrow. B) Representative images of tumor sections after the treatments: 1 – tumor tissue is clearly distinct from the dermal elements and subcutaneous tissue, as it displays pronounced cellular atypia and aggressive growth (arrow); 2 – tumor cell fibers interleave with fragments of muscle fibers (arrows); 3 – massive necrosis of tumor tissue (arrow). С) Percentage of surviving animals bearing Krebs-2 ascites and treated with hDNA, CP + saline or CP + hDNA 1–12 hours post CP injection (number of experiments, n = 3-5). Survival in the groups was compared daily. D) Changes in weight of animals engrafted with Krebs-2 ascites after CP + saline or CP + hDNA 1–12 or 18–30 hours post CP injection. Initial weight of animals was taken as 100%. Average weight of mice is shown (n = 8). Е) Comparison of ascites weight in animals treated with CP + saline vs CP + hDNA (1–12 or 18–30 hours post CP treatment), on day 8 after the treatments (n = 8).