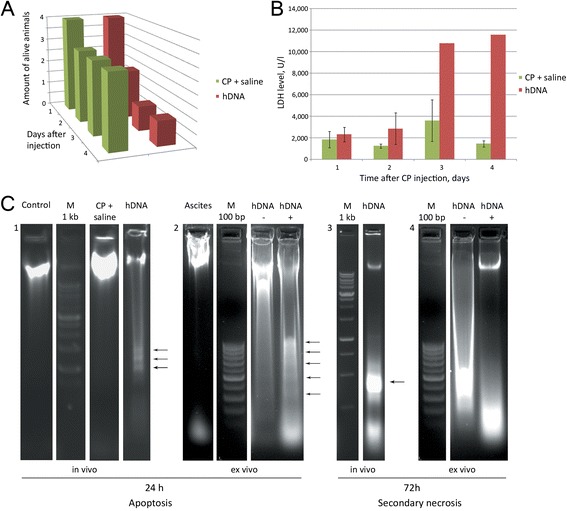
Figure 3.

Analysis of apoptosis induction in ascitic cells 24 or 72 hours after first hDNA injections. А) Survival of Krebs-2 ascites-engrafted animals after hDNA or CP + saline treatments. B) LDH levels measured in ascitic fluid collected from hDNA or CP + saline groups of mice (n = 4-5). C) Electrophoretic separation of DNA isolated from ascitic fluid of mice 24 and 72 hours after injections of hDNA (in vivo) or from culture medium following 24 or 72 hours incubation of ascites with hDNA (ex vivo) 1 – Control lane shows DNA of untreated Krebs-2 ascites, hDNA lane represents ascitic fluid DNA isolated 24 hours post direct hDNA injections into ascites; 2 – Ascites – DNA from intact ascites, hDNA- and hDNA + − 24 hour incubation of Krebs-2 ascites in the absence (−) or presence (+) of hDNA, respectively. Arrows on the hDNA+ lane show characteristic pattern of nucleosomal fragmentation of chromatin; 3 – hDNA – DNA isolated from ascitic fluid 72 hours after hDNA injections directly into ascites grafts. Arrow indicates specific DNA band originating from necrotic cells; 4 – hDNA- and hDNA + − incubation of Krebs-2 ascites for 72 hours in the absence or presence of hDNA preparation, respectively. By 24 hours, apoptotic pattern is already noticeable, whereas by 72 hours it transitions into the pattern characteristic of secondary necrosis.
