Figure 2.

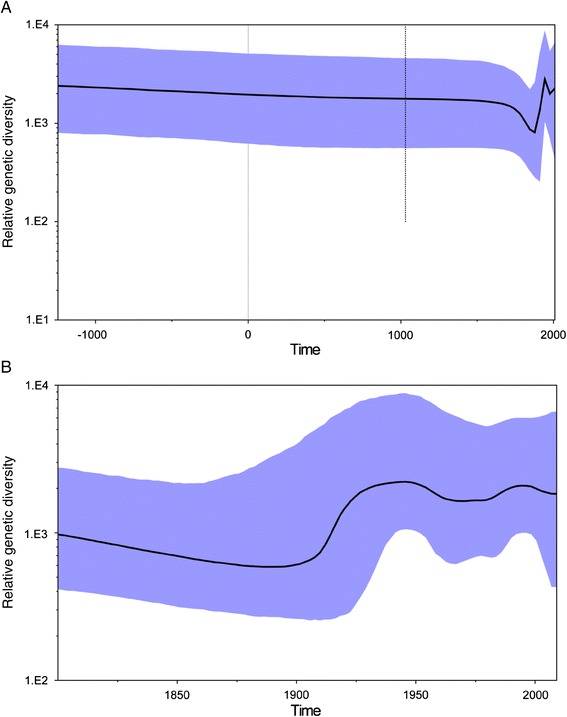
Bayesian skyline plots for JEV. Highlighted areas correspond to 95% HPD intervals. (A) Populations during the whole evolutionary history; (B) Populations during the later evolutionary history since 1800.

Bayesian skyline plots for JEV. Highlighted areas correspond to 95% HPD intervals. (A) Populations during the whole evolutionary history; (B) Populations during the later evolutionary history since 1800.