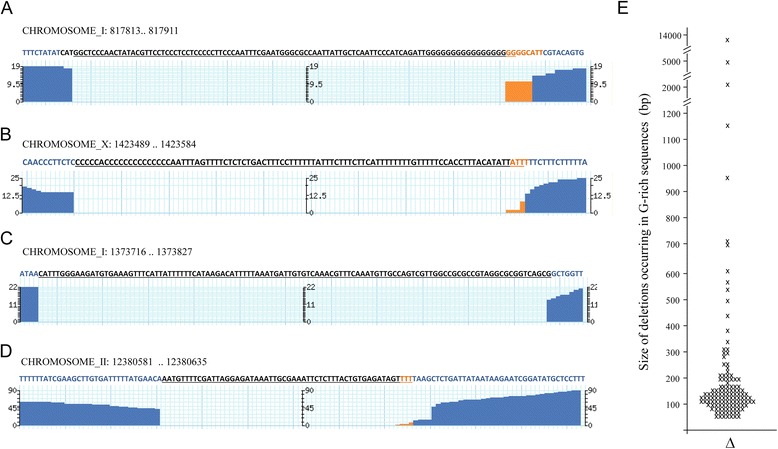
Figure 3.

The majority of large deletions initiates at G-rich DNA. Figures (A) through (D) are Genome Browser snapshots of single deletions; x-axis represents genome location, while y-axis represents number of reads that cover the region; blue reads depict coverage of more than 10, while orange depicts 10 or less; the gaps depict no coverage, which is indicative of deletions. The reference sequence is depicted with deleted bases underlined. (A) A 99 bp deletion that initiates at G20 homopolymer. (B) A 96 bp deletion that initiates at G14TG6AGAAG3 sequence. (C) A 112 bp deletion that initiates at a G-rich sequence, G2N3G2N5G2N2G2. (D) A 55 bp deletion that initiates at a non G-rich sequence. (E) Size distribution of homozygous deletions that occur at G-rich sequences (n = 123).
