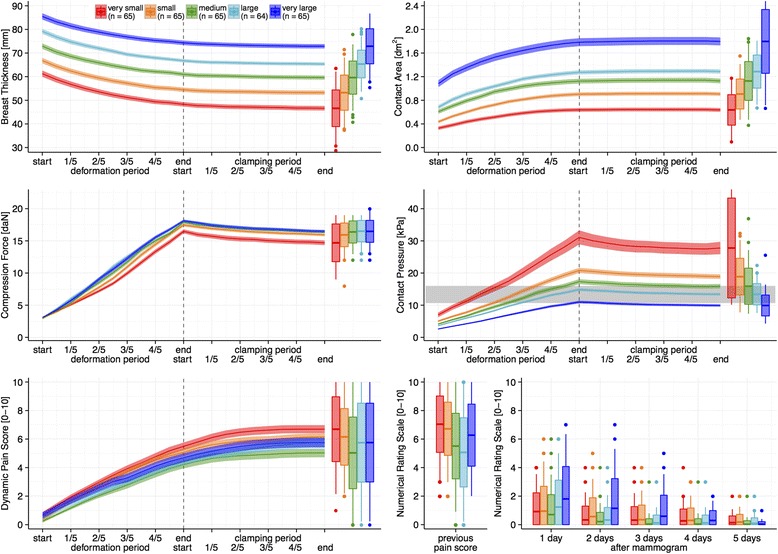
Figure 3.

Mean ± 95% confidence interval for all 324 compressions stratified by breast volume into five equally sized groups: Progression of the recorded variables and the dynamic pain scores on a relative time scale. Boxplots represent the distributions of values at the end of compression as well as (bottom right) for recollected pain scores of the previous mammogram and for pain scores five days after the mammogram. Boxes are mean ± one standard deviation and whiskers extend until the furthest outlier with a maximum of one standard deviation. For reference: the gray horizontal bar in the middle-right panel indicates the range of normal blood pressures.
