Figure 4.

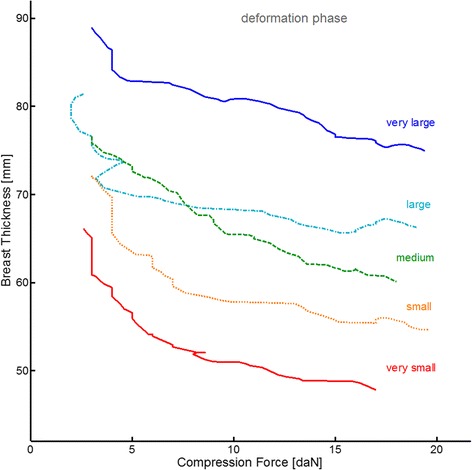
Breast deformation curves for five selected example compressions. The curves are obtained by plotting the Th(t)-values from the deformation phase as function of the corresponding and simultaneously recorded F(t)-values.

Breast deformation curves for five selected example compressions. The curves are obtained by plotting the Th(t)-values from the deformation phase as function of the corresponding and simultaneously recorded F(t)-values.