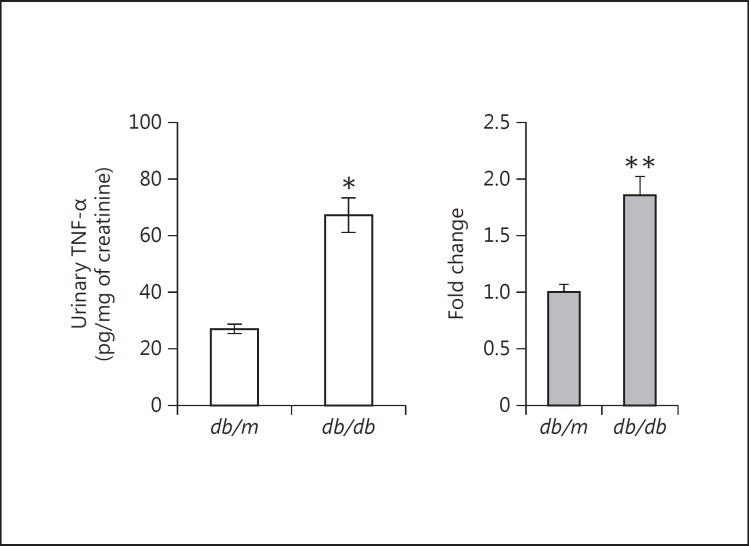
Fig. 10.
TNF-α levels in the urine, kidney and plasma of db/db diabetic mice. Urinary TNF-α was significantly increased in db/db mice after 8 weeks of type 2 diabetes vs. control nondiabetic db/m mice. * p < 0.001 vs. db/m mice. However, there were no significant differences between db/m and db/db mice in the concentrations of TNF-α protein in the kidneys or plasma (data not shown). At the mRNA level, though, TNF-α was significantly increased in the kidneys of db/db versus db/m mice. ** p < 0.05 vs. db/m kidneys (n = 10 in both groups).

