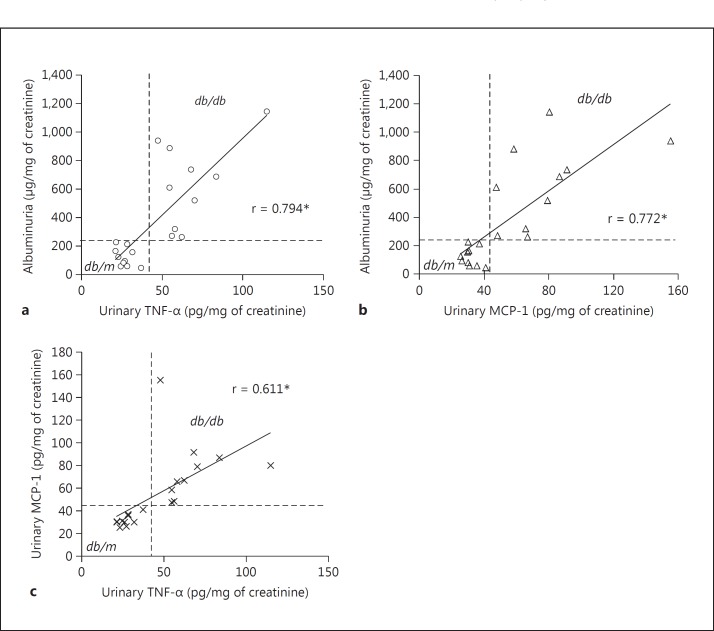
Fig. 12.
Correlations between urinary TNF-α, urinary MCP-1 and albuminuria in db/m and db/db mice. a Urinary TNF-α was significantly correlated with albuminuria (r = 0.794). b Urinary MCP-1 was also well correlated with albuminuria (r = 0.772). c In turn, both urinary TNF-α and urinary MCP-1 were correlated with each other (r = 0.611). In each graph, the db/m and db/db datapoints cleanly segregate into opposite quadrants as drawn. * p < 0.001 for all comparisons (n = 10 in both groups).

