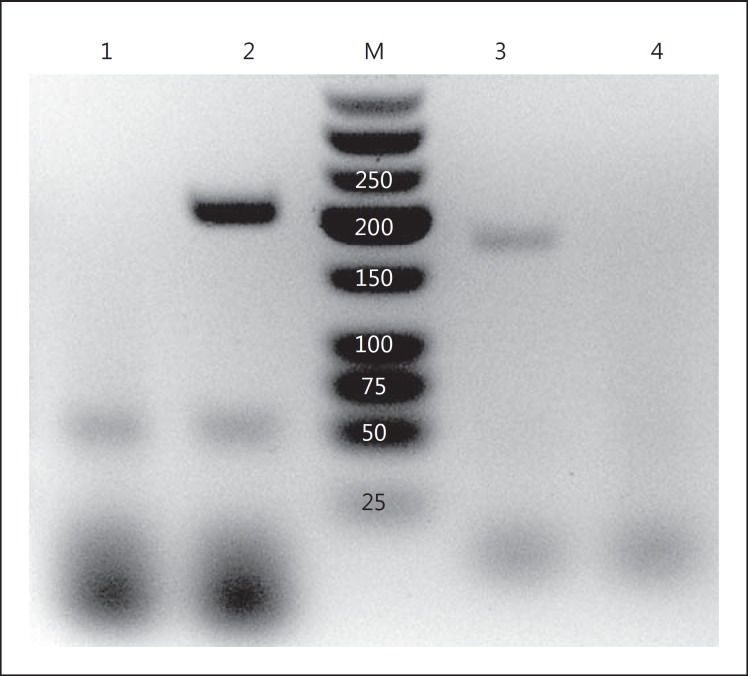
Fig. 3.
RT-PCR demonstrating gene expression of the TNFRs in podocytes. Total mRNA in the podocyte was DNase I-treated and then reverse-transcribed using oligo-dT. PCR was performed using exon-junction spanning primer pairs that are specific for the murine TNFR1 and TNFR2. On the agarose gel, PCR product bands are positive for both TNFR1 and TNFR2, with predicted amplicon sizes of 197 and 171 bp, respectively. As a negative control, the RT reaction was omitted, and the PCR bands no longer appear. 1 = TNFR1, DNase I-treated, not reverse-transcribed; 2 = TNFR1 primers; 3 = TNFR2 primers; 4 = TNFR2, DNase I-treated, not reverse-transcribed; M = marker in bp.

