
Figure 3.
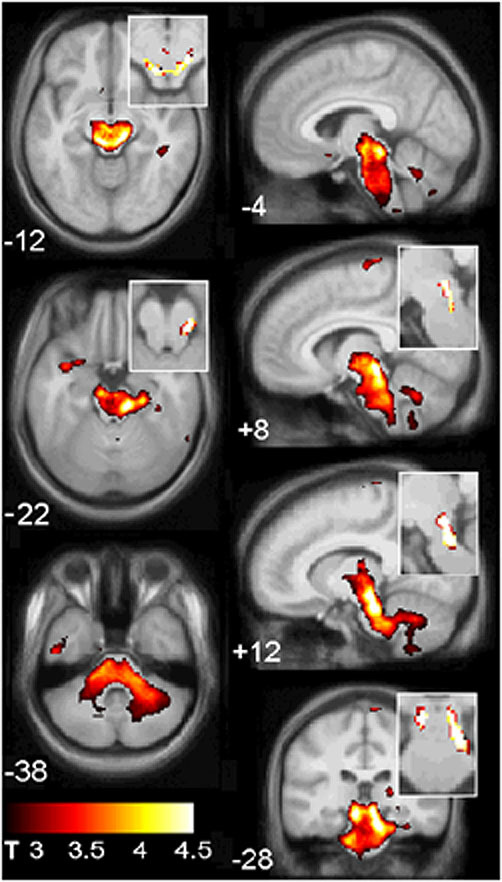
T1w results from a group × seated pulse pressure (PP) interaction (Table 3, item 1) involving the midbrain and hindbrain, shown on the mean gradient echo sections from the present study. The cluster was formed with a threshold of uvP = 0.005. Magnified inserts with a more stringent threshold (uvP < 0.0001) locate the peak significance to the midbrain reticular substance and periaqueductal grey matter.