
Figure 5.
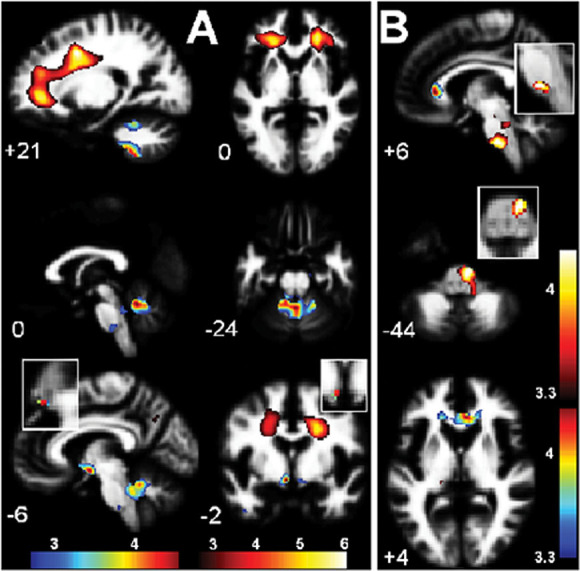
White matter (WM) volume interaction results for (A). Group × asleep heart rate (Table 3, items 2, 7, 8 and Fig. 4B,C), and (B). Group × seated diastolic blood pressure (BP) (Table 3, item 5) interaction regressions. In (A) significant clusters formed with a uvP = 0.005 threshold were observed bilaterally in deep prefrontal WM and in the cerebellar vermis and hypothalamus. In (B) a significant cluster formed with a uvP = 0.005 threshold is seen in the caudal basal pons. The two colour bars distinguish between different polarity interactions (e.g. Fig. 4B, C). Thus, in (A) red–yellow–white indicates where as asleep heart rate (HR) increases, WM volume decreases in chronic fatigue syndrome (CFS) but increases in normal controls (NC), whereas blue–green–red indicates the reverse. Magnified inserts locate the clusters in the hypothalamus (A) and pons (B) with a more stringent threshold of p = 0.0005. The background image is the mean white matter image from the present study.