
Figure 1.
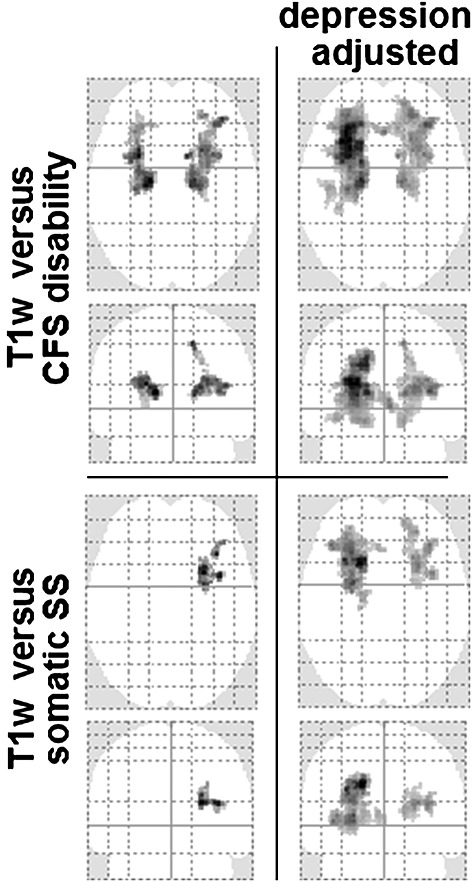
Axial and coronal projections of T statistic maxima showing cluster location and extent in prefrontal white matter (WM) for T1-weighted spin-echo (T1w) versus chronic fatigue syndrome (CFS) disability (top) and T1w versus somatic symptom score (SS) (bottom), before (left) and after (right) adjustment for depression. The voxel P threshold for cluster formation was 0.005.